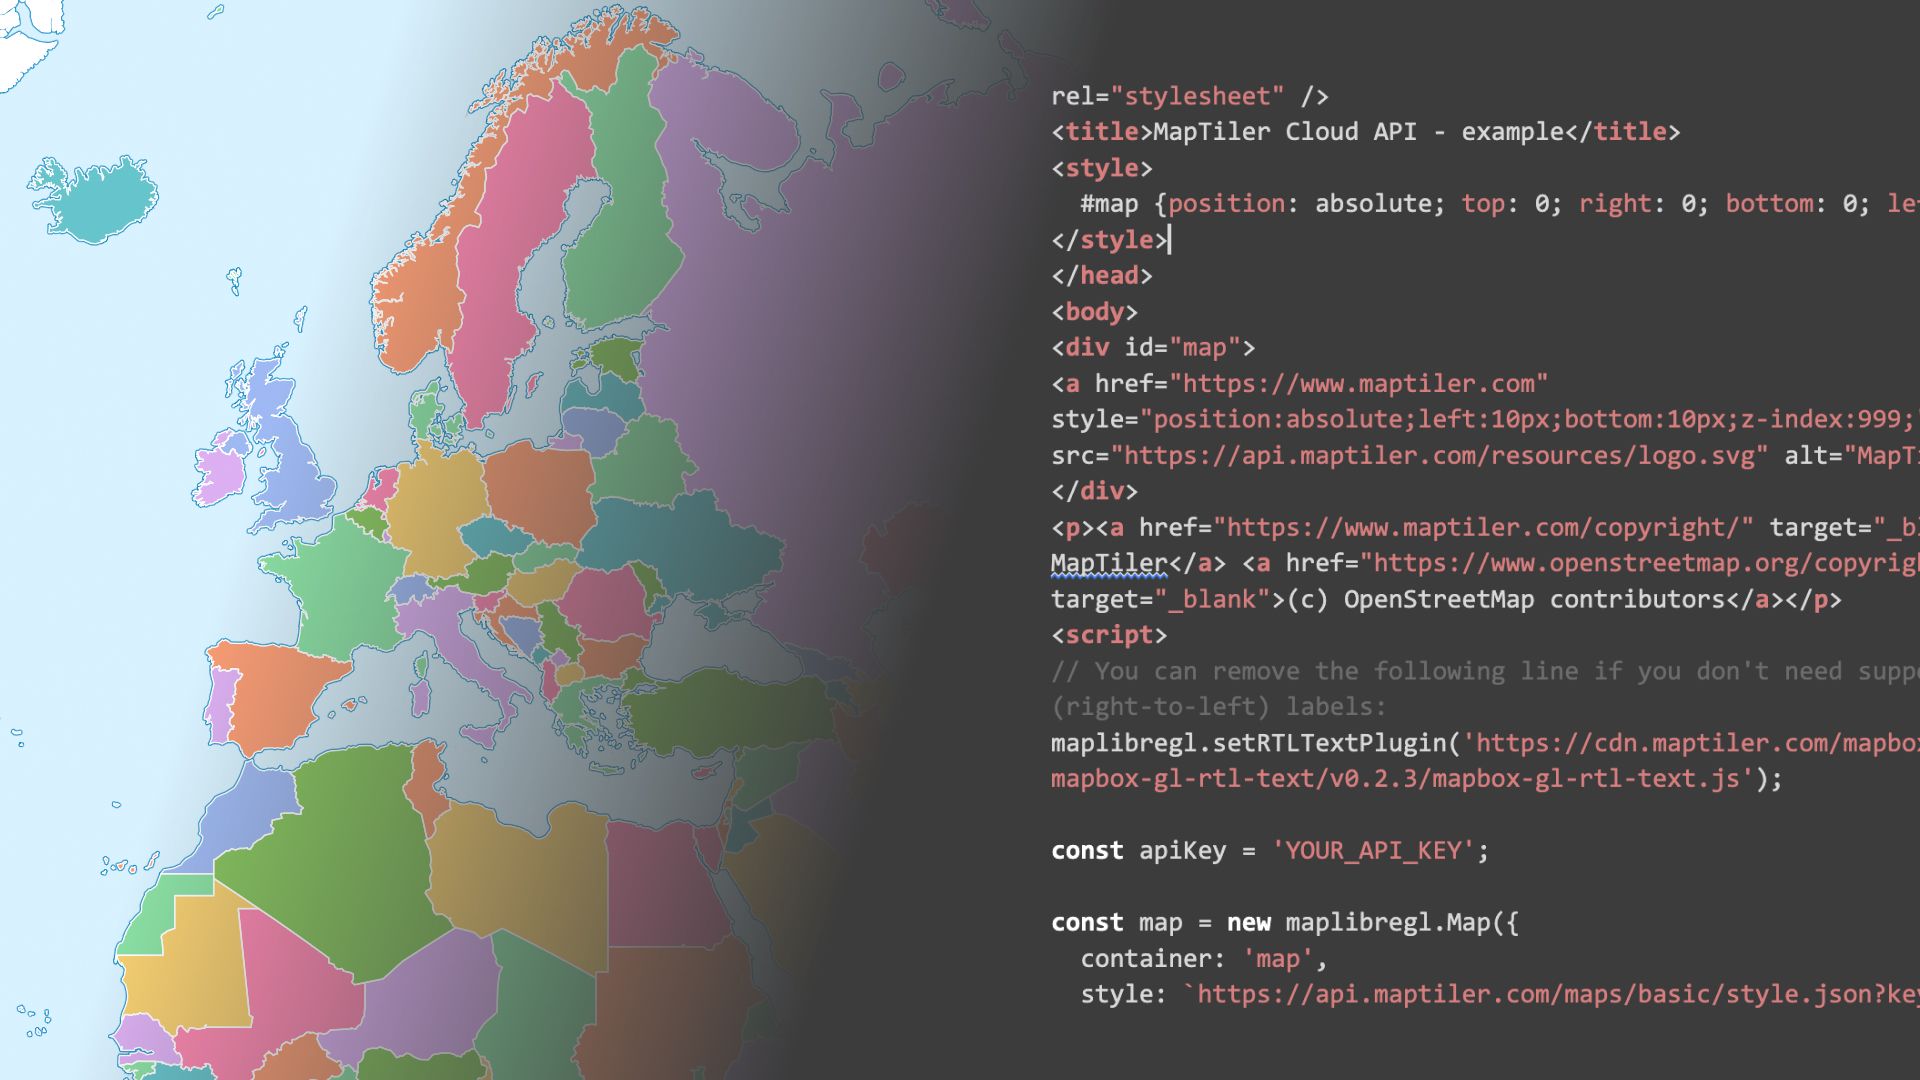
This article describes how to create geoportal with a custom map, own data, map legend, place name search, the satellite view of a selected building, and a streetview. By reading, you will learn how to transform data into MBTiles, upload it to your MapTiler Cloud account, and visualize it in an application developed with MapTiler SDK.
Your final map will look like this (click on any building to see the magic):
Download the map data
The first thing we will do is download some building’s data from the Cadastre of Spain. In the example, we will use the data of the municipality of Sant Feliu de Guixols.
The data can be downloaded from the following link: SANT FELIU DE GUIXOLS/A.ES.SDGC.BU.17170.zip
Once we have downloaded the data, we will unzip the zip file. Inside the zip file, there is a file called A.ES.SDGC.BU.17170.building.gml with the building’s information; this file is in GML format.
Convert GML file to MBTiles
To transform the GML file to MBTiles we have several options:
- MapTiler Engine: this tool allows us to transform our data into MBTiles or GeoPackage easily. We can also directly upload the transformed data to our cloud account. If you want to know more, check out the Vector tiles generating (basic) article.
GDAL/ogr2ogr: if you have GDAL/ogr2ogr installed on your computer you can also transform the GML file into an MBTiles using the following command:
ogr2ogr -f MVT guixols.mbtiles A.ES.SDGC.BU.17170.building.gml -dsco MAXZOOM=18 -dsco MINZOOM=9 -mapFieldType DateTime=StringMapTiler Engine CLI: It creates automated workflows with the full power of MapTiler Engine. If you want to know more about MapTiler Engine, check out the MapTiler Engine Support page. To transform the gml file to mbtiles using the MapTiler Engine you must execute the following command:
maptiler-engine -o guixols.mbtiles A.ES.SDGC.BU.17170.building.gml
As we can see, MapTiler Engine is in charge of calculating the optimal zoom levels for our data and performing the corresponding transformation of the data types. In the GDAL example, we have to define the zoom levels and indicate the transformations of the alphanumeric data types so that they are valid data types in MBTiles.
Upload your geodata to MapTiler Cloud
We have already mentioned that you can upload data directly to the MapTiler Cloud from MapTiler Engine; another way to upload MBTiles is through the MapTiler Cloud Admin API.
There are numerous ways to send your requests to the API; whether you are a fan of API clients or go with the good old curl, don’t forget to set the Authorization header in the form of Token {YOUR_TOKEN} so we know it’s you making the requests. To make your life easier, we have also created a CLI utility to upload the tilesets.
Doing the whole process manually via curl involves making multiple API calls. For example, calling the Admin API to start the ingest. The Admin API returns a Google Drive URL to upload the file. Then call the Google Drive API to upload the file and finally call the Admin API to process the file.
To make your life easier, we have developed the MapTiler Cloud CLI utility to upload the tilesets. This open-source tool is developed in Python and allows you to automate the process of uploading data to the cloud. You can access the code in the MapTiler Cloud CLI GitHub repository.
We will use the MapTiler Cloud CLI tool to upload the data to the cloud.
Once we have installed the CLI tool we must start the virtual environment where the tool is installed. Next, execute the following command to upload the MBTiles file to the MapTiler Cloud:
maptiler-cloud --token=YOUR_CREDENTIAL_TOKEN tiles ingest guixols.mbtilesDevelop an application with a map to display your data
To visualize the data from MapTiler Cloud we are going to make an application using the MapTiler SDK library.
Create a map
The first thing we are going to do is to create a map where we can display our data. To load the reference cartography of our map we will call the MapTiler Cloud API. MapTiler Cloud has many ready-to-use basemap styles to suit a wide range of use cases.
If you have never worked with MapTiler SDK we recommend you check out the Get started integrating maps example. Check out all these examples to discover how much quicker developing with the MapTiler SDK can be!
Create a file called index.html and copy the following code:
<html lang="en">
<head>
<meta charset="UTF-8">
<meta http-equiv="X-UA-Compatible" content="IE=edge">
<meta name="viewport" content="width=device-width, initial-scale=1.0">
<title>MapTiler Cloud API - example</title>
<script src="https://cdn.maptiler.com/maptiler-sdk-js/v1.1.2/maptiler-sdk.umd.js"></script>
<link href="https://cdn.maptiler.com/maptiler-sdk-js/v1.1.2/maptiler-sdk.css" rel="stylesheet" />
<style>
body {margin: 0; padding: 0;}
#map {position: absolute; top: 0; bottom: 0; width: 100%;}
</style>
</head>
<body>
<div id="map"></div>
<script>
maptilersdk.config.apiKey = 'YOUR_MAPTILER_API_KEY_HERE';
const map = new maptilersdk.Map({
container: 'map', // container id
style: maptilersdk.MapStyle.BASIC,
center: [-3.15, 40.33],
zoom: 5,
hash: true
});
</script>
</body>
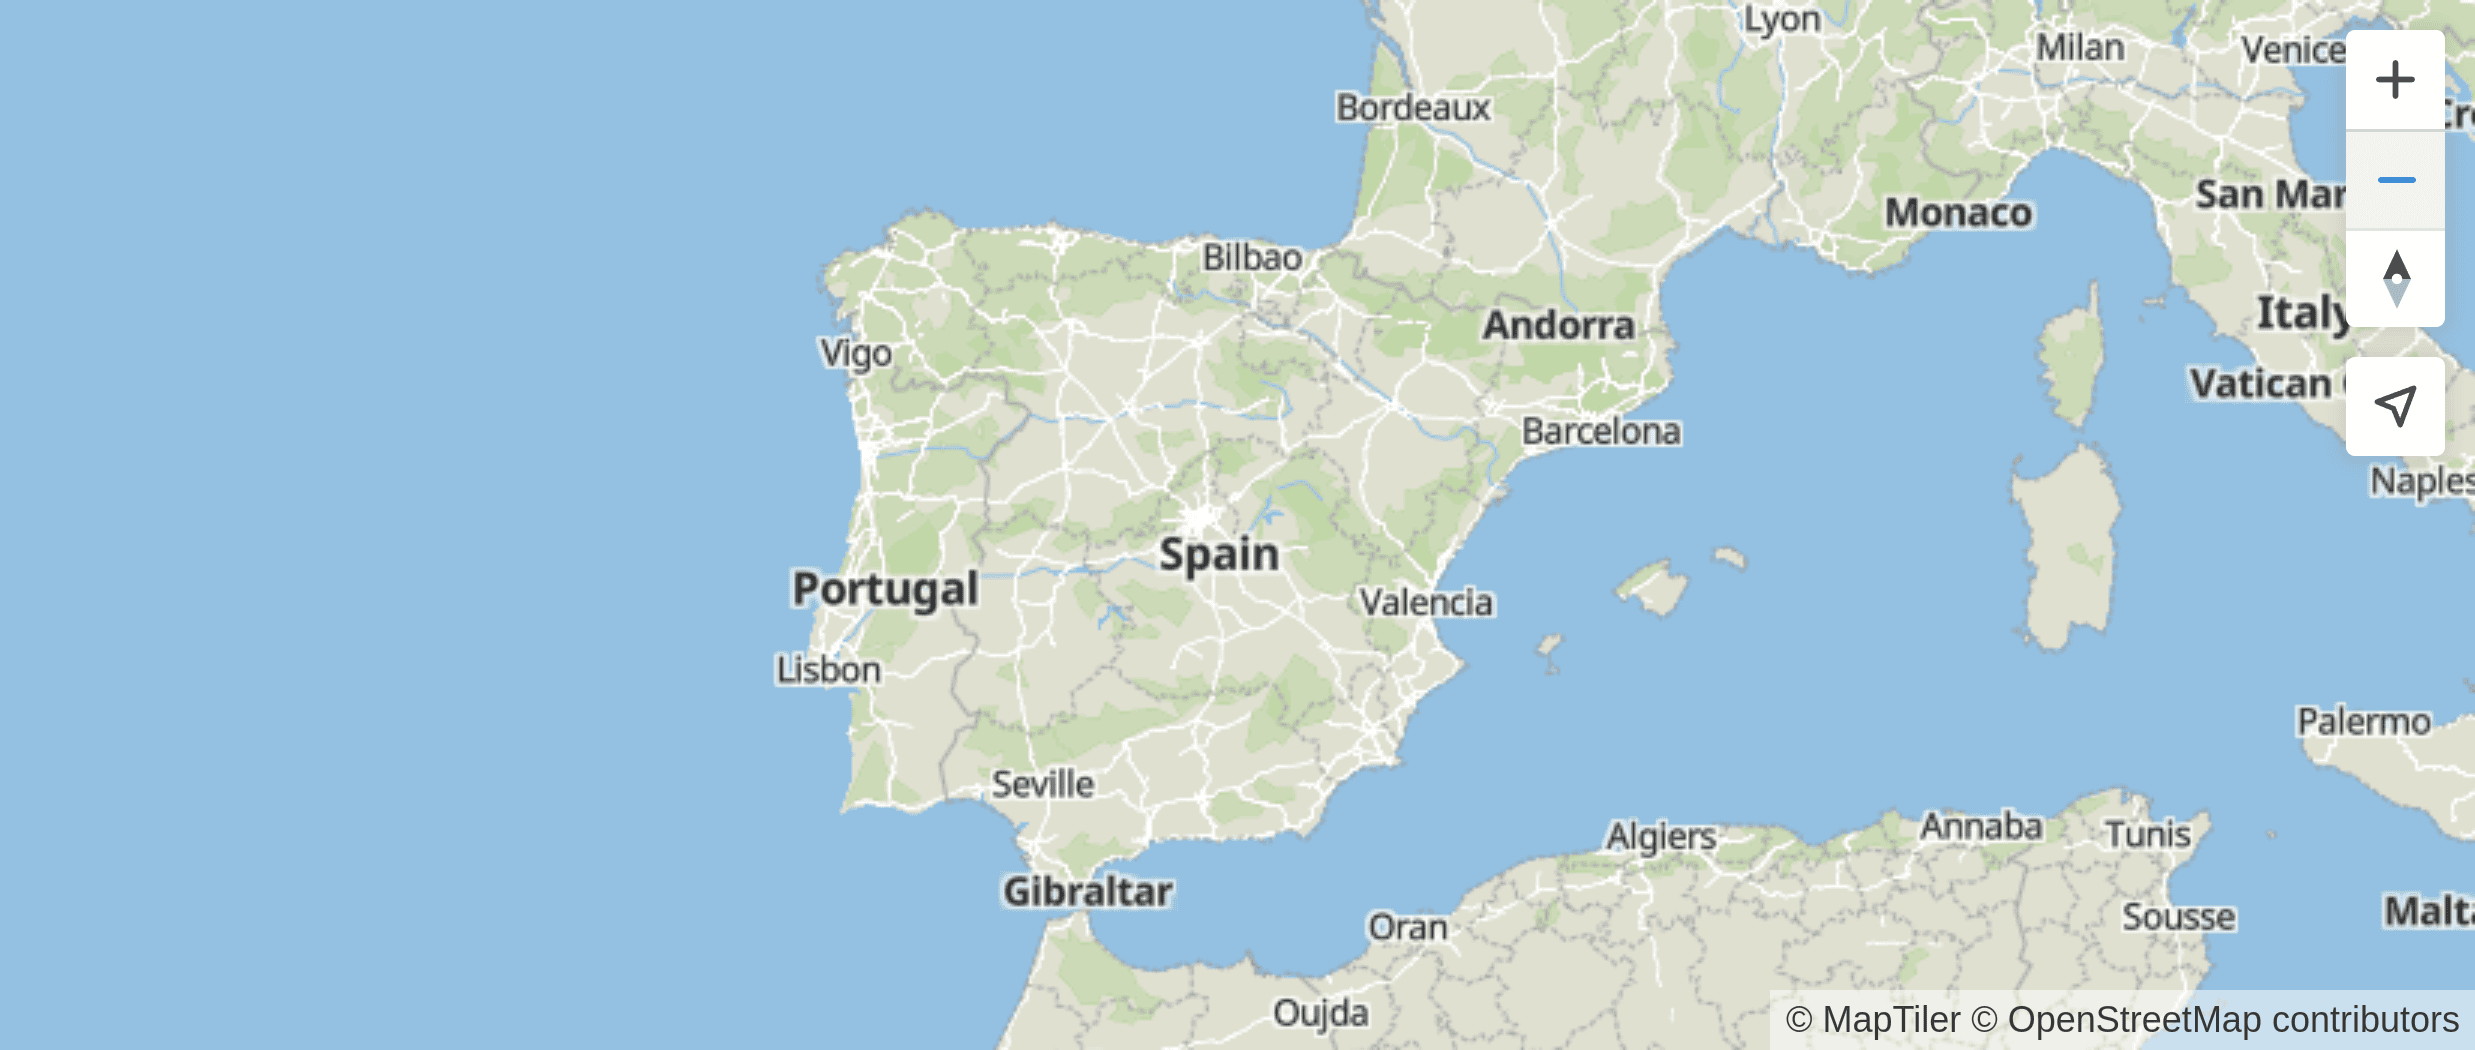
</html>Open the application in a browser and you should see a map like the following image
Create the geocoding control
Let’s add a control that allows us to search for locations. For this, we are going to use the Geocoding Control.
To load the geocoder component add the highlighted lines in the header of the index.html file.
<script src="https://cdn.maptiler.com/maptiler-geocoding-control/v0.0.98/maptilersdk.umd.js"></script>
<link href="https://cdn.maptiler.com/maptiler-geocoding-control/v0.0.98/style.css" rel="stylesheet"/>
Just after where we create the map write:
const gc = new maptilersdkMaptilerGeocoder.GeocodingControl({});
map.addControl(gc, 'top-left');
You should now see the search control in the upper left corner of the map.
Visualize your map data
To add our data to the map we must first declare a new data source and then add a new layer with the information from this data source.
Initializing the map on the page tells the browser to request the style. This can take some time depending on how fast the server can respond to that style request and how long it takes for the browser to render the map (usually milliseconds). These resources are remote so they are executed asynchronously, it’s important to make sure the style is loaded before running any more code.
The map object can inform the browser about certain events that occur when the state of the map changes. One of these events is the load event, this event is triggered when the style has been loaded into the map.
Add a data source to the map
Through the map.on(‘load’, callback function) method we can ensure that none of the rest of the callback code is executed until that event occurs.
map.addControl(gc, 'top-left');

map.on('load', () => {
  // the rest of the code will go in here
});
Therefore we must call the addSource function inside a map.on(‘load’) function so that the new source is not loaded before the map is rendered.
map.on('load', () => {
  // the rest of the code will go in here
  map.addSource("building_source", {
  "type": "vector",
  "url": `https://api.maptiler.com/tiles/YOUR_TILESET_ID/tiles.json`
  });
});
In the code snippet above we are using the MapTiler Cloud API to reference the TileJSON that was generated when uploading our data to the MapTiler Cloud.
Add a layer to the map
Once we have defined the data source we can add the layer to the map. For this, we will use the addLayer function. Just after the addSource write the next lines:
map.on('load', () => {
// the rest of the code will go in here
map.addSource("building_source", {
"type": "vector",
"url": `https://api.maptiler.com/tiles/YOUR_TILESET_ID/tiles.json?key=${apiKey}`
});
map.addLayer({
"id": "building_pol",
"type": "fill",
"source": "building_source",
"source-layer": "Building",
"layout": {
"visibility": "visible"
},
"paint": {
"fill-color": "#3A1888",
"fill-opacity": [
"literal",
0.6
]
},
"filter": ["all",
["==", "$type", "Polygon"]
],
}, "airport");
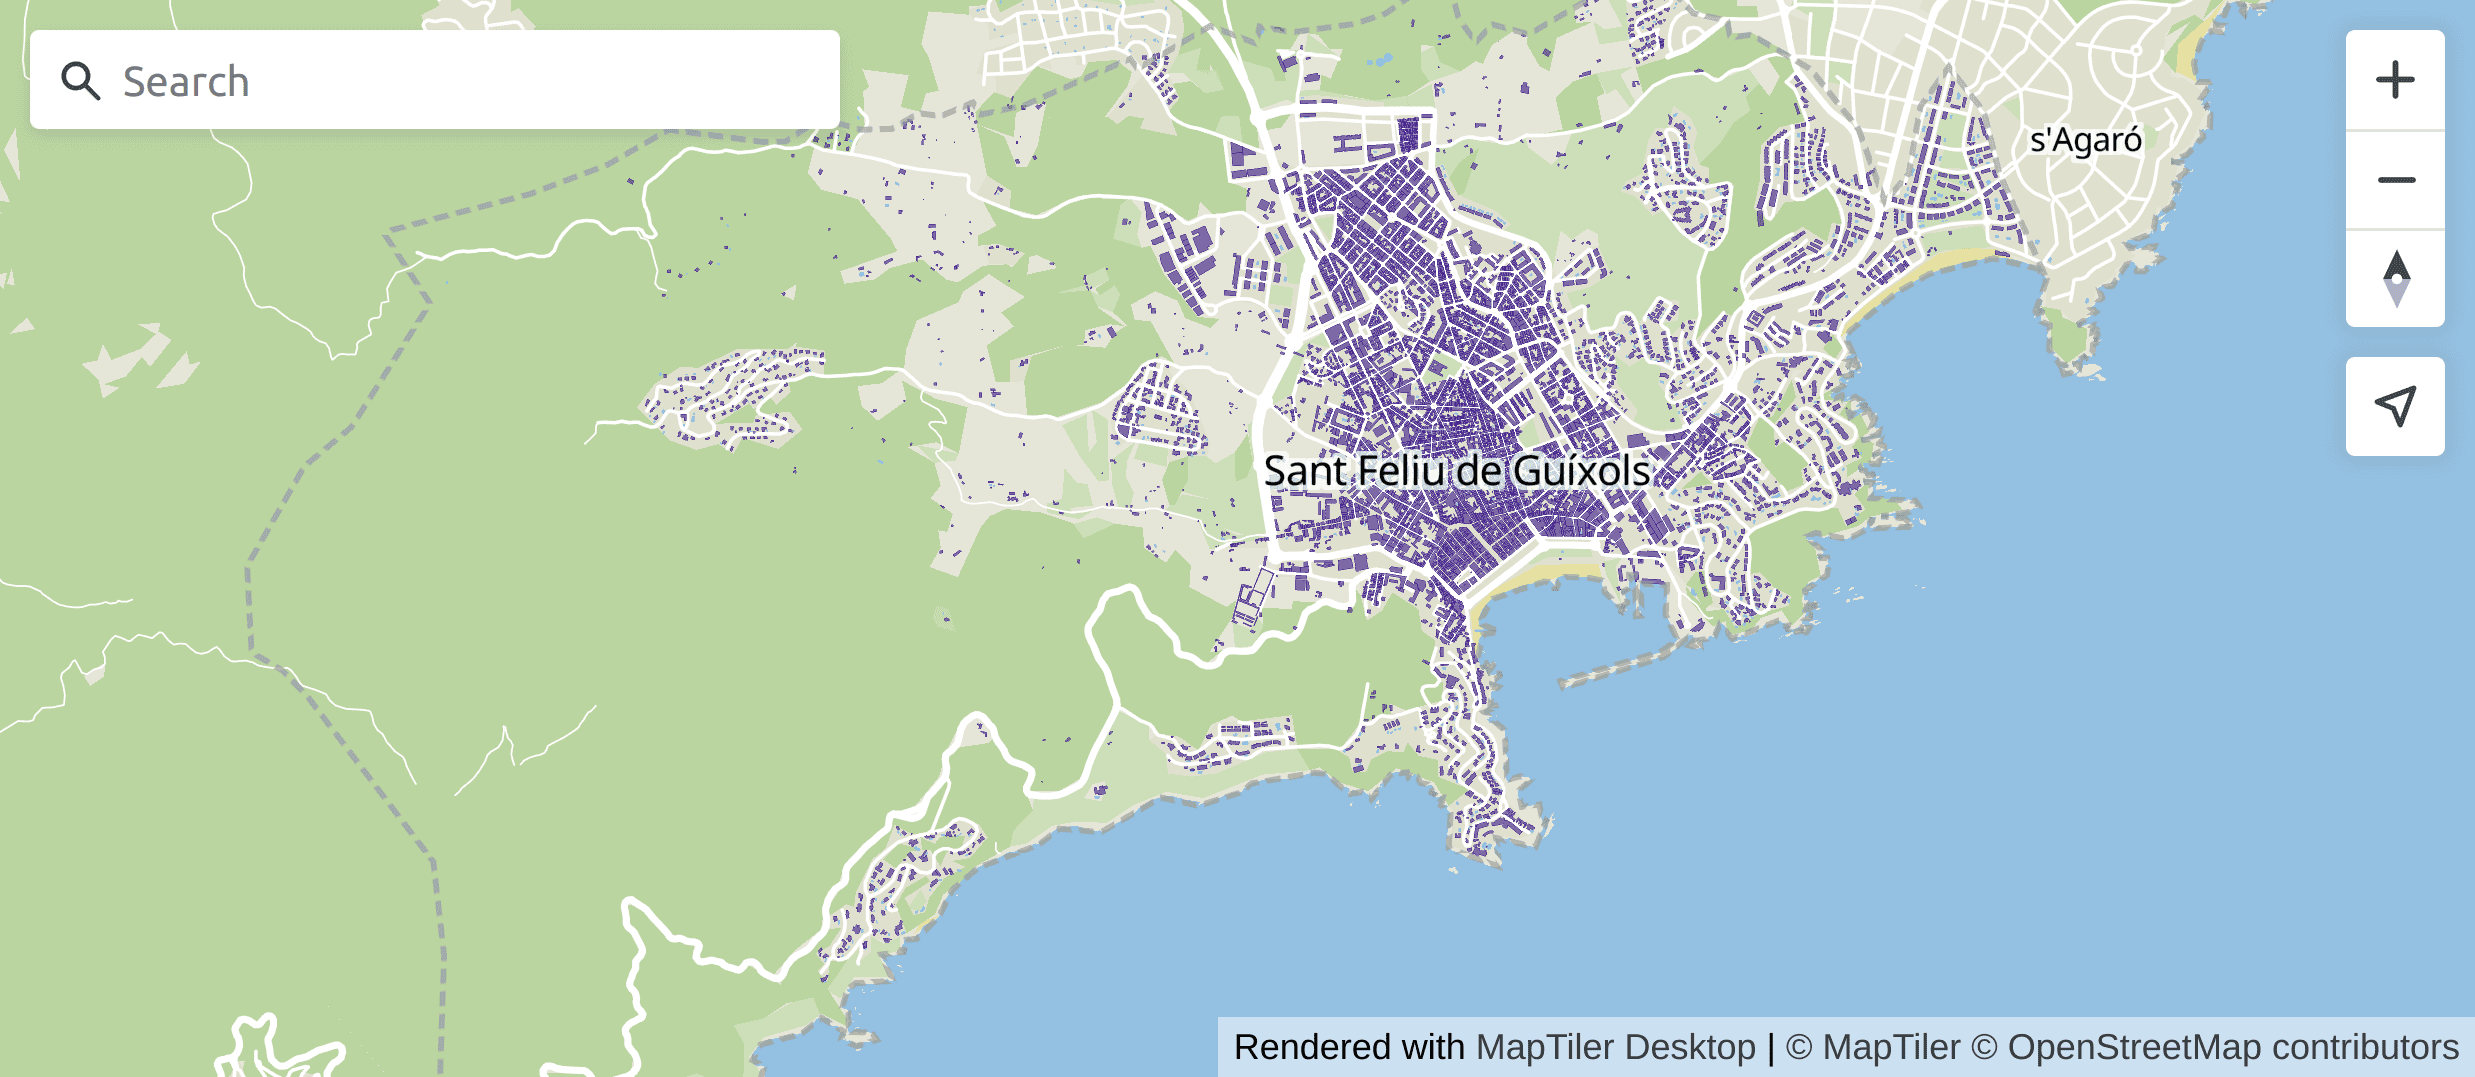
});In the code snippet above we are adding the buildings layer just before the airport labels layer. We do this so that the polygons of the buildings appear on the map below the labels and do not hide the texts of street names, neighborhoods, etc.
Reload the application and type Sant Feliu de Guíxols in the search engine and select the first entry in the list of results. The application will zoom in on the municipality of Sant Feliu de Guíxols and you will see the buildings layer.
Show building information on click
We have already seen how to add and display your own data on a map. The next thing we will do is show information related to a building when you click on it. For this, we will use the click event of the map.
After adding the layer to the map we will write the following code:
const createPopupContent = (feature) => {
return `<div><strong>Reference: <a href="${feature.properties.informationSystem}" target="_blank" rel="noopener noreferrer">${feature.properties.reference}</a></strong></div>
 <div>${feature.properties.value}${feature.properties.value_uom}</div>
 <div><strong>Use</strong>:${feature.properties.currentUse}</div>
 <div><strong>Date</strong>:${new Date(feature.properties.end).getFullYear()}</div>
 <div><img src="${feature.properties.documentLink}" style="width:220px;height:165px"></div>
`;
}

map.on('click', 'building_pol', function (e) {
const content = createPopupContent(e.features[0]);
new maptilersdk.Popup()
.setLngLat(e.lngLat)
.setHTML(content)
.addTo(map);
});
In this code snippet, we are defining a function (createPopupContent) to create the content to display and we are registering the map click event for our building layer.
To improve the user experience we are going to make the cursor pointer change when hovering over a building; so the user will know that he can interact with the buildings.
Write the following after where we add the click event:
map.on('click', 'building_pol', function (e) {
  const content = createPopupContent(e.features[0]);
  new maptilersdk.Popup()
  .setLngLat(e.lngLat)
  .setHTML(content)
  .addTo(map);
});

map.on('mouseenter', 'building_pol', () => {
  map.getCanvas().style.cursor = 'pointer';
});

map.on('mouseleave', 'building_pol', () => {
  map.getCanvas().style.cursor = '';
});
Create a choropleth map of the buildings
To create the choropleth map of the buildings, we are going to change the style of the buildings layer and use the alphanumeric data associated with the buildings to classify and paint them according to the value of a given field. In this case, we are going to use the currentUse field to do the classification.
If we look at the alphanumeric data of the buildings layer we will see that for the currentUse field there are 6 possible values. We will create an array with these values and assign them a text and a color.
Right after where we declare the variable with the API key we write the following:
maptilersdk.config.apiKey = 'slEr7lXnTotdWgNA0oLf';

const categories_field = "currentUse";
const categories = [
  {id: "1_residential", text: "Residential", color: "#FFD65F"},
  {id: "2_agriculture", text: "Agriculture", color: "#35C186"},
  {id: "3_industrial", text: "Industrial", color: "#805CC2"},
  {id: "4_1_office", text: "Office", color: "#FF8F65"},
  {id: "4_2_retail", text: "Retail", color: "#3388F1"},
  {id: "4_3_publicServices", text: "Public Services", color: "#E25041"},
];
With this array of categories and colors, we are going to create the createFillColor function to generate an expression to determine the color with which we will paint the buildings.
const createFillColor = (categories, categories_field) => {
  const colors = categories.reduce((agg, item) => {
    agg.push(item.id);
    agg.push(item.color);
    return agg;
  }, []);
  return [
    "match",
    [
      "get",
      categories_field
    ],
    ...colors,
    "#ccc"
  ]
}
Modify the fill-color property of the buildings layer so that instead of having a color defined (“#3A1888”) it uses the createFillColor function to determine the value.
"paint": {
"fill-color": createFillColor(categories, categories_field),
"fill-opacity": [
"literal",
0.6
]
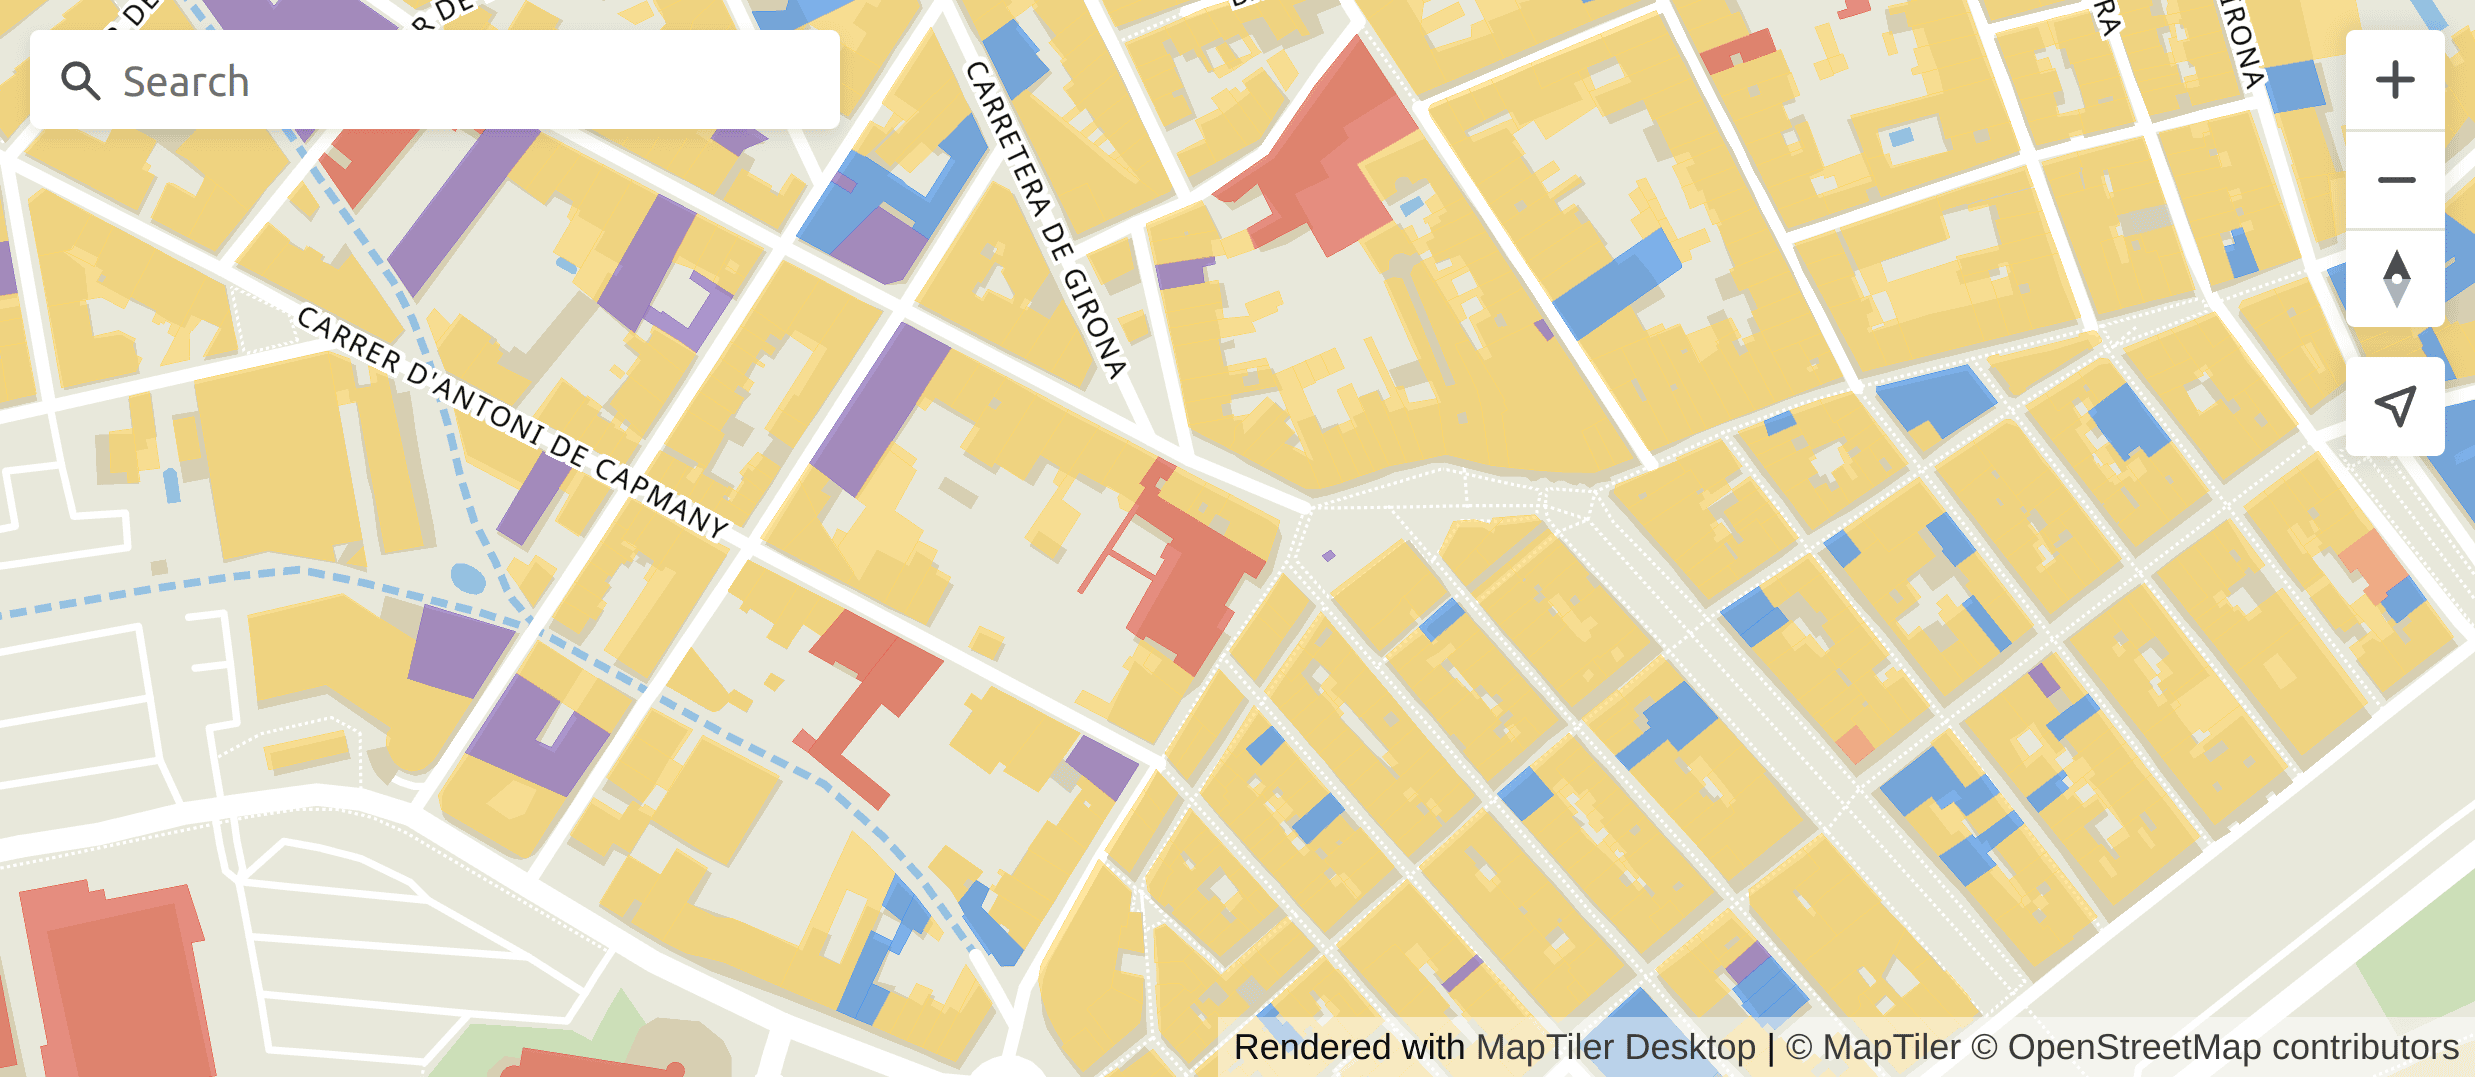
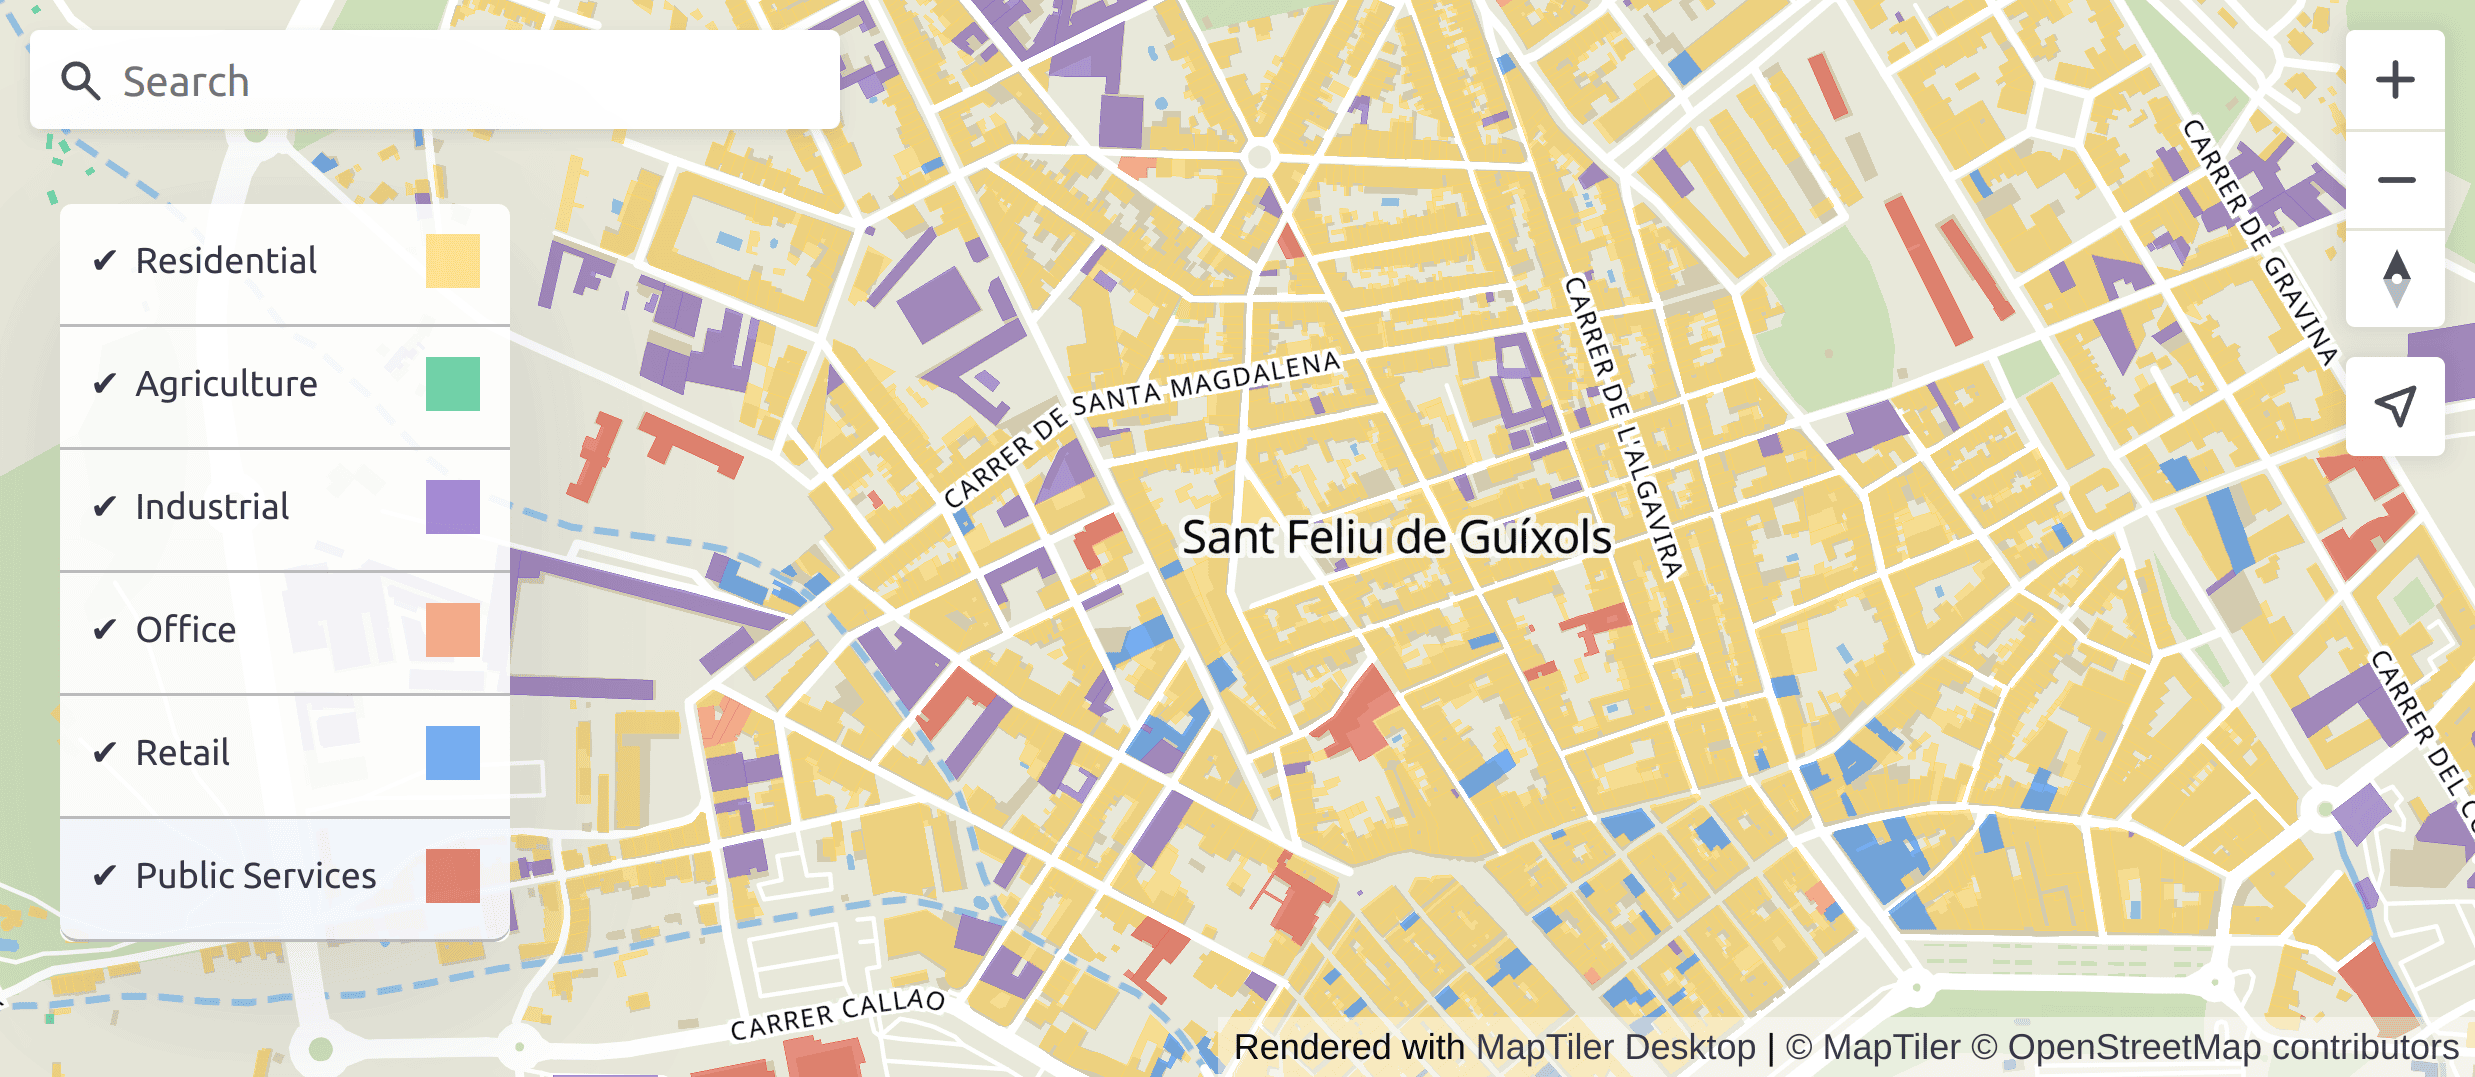
},When reloading the application we will see that we have the buildings painted in different colors according to their use.
Create an interactive map legend
We will create an interactive legend on the map, to show the classification colors, and also change the visualization of which categories are active or inactive.
The first thing we will do is create a function to create the layer filter. We’ll use the filter property of the layer to determine which categories we want to show on the map. This will allow us to change the display of active and inactive categories.
const createFilter = (categories, categories_field) => {
  const filters = categories.reduce((agg, item) => {
    agg.push(["in", categories_field, item.id]);
    return agg;
  }, []);
  return [
    "all",
    ["==", "$type", "Polygon"],
    ["any",
      ...filters
    ]
  ]
}
Modify the filter property of the buildings layer
"paint": {
    "fill-color": createFillColor(categories, categories_field),
    "fill-opacity": [
      "literal",
      0.6
    ]
  },
  "filter": createFilter(categories, categories_field),
}, "airport");
Create the legend control
Before creating the legend control we will create a couple of functions that will allow us to toggle the visibility of the categories. Next to the creation of the function createFilter write these lines:
const removeAtIndex = (arr, index) => {
  const copy = [...arr];
  copy.splice(index, 1);
  return copy;
};

const toggle = (arr, item, getValue = item => item) => {
  const index = arr.findIndex(i => getValue(i) === getValue(item));
  if (index === -1) return [...arr, item];
  return removeAtIndex(arr, index);
}
Just below where we added the search control copy the following:
map.addControl(gc, 'top-left');

class legendControl {
  constructor (categories, field) {
    this.categories = categories;
    this.field = field;
  }

  onAdd(map) {
    this._map = map;
    this._container = document.createElement('div');
    this._container.className = 'maplibregl-ctrl';
    const _fragment = document.createDocumentFragment();
    const _nav = document.createElement('nav');
    _nav.className = 'maplibregl-ctrl filter-group';
    _nav.id = 'filter-group';
    _fragment.appendChild(_nav);
    this.categories.forEach(element => {
      const _input = document.createElement('input');
      _input.type = "checkbox";
      _input.id = element.id;
      _input.className = "input-layers";
      _input.checked = true;
      const this_ = this;
      _input.addEventListener('change', function (e) {
        this_.updateLegend(e.target.id);
      });
      const _label = document.createElement('label');
      _label.htmlFor = element.id;
      const _text = document.createTextNode(element.text);
      const _legend = document.createElement('i');
      _legend.style.backgroundColor = element.color;
      _label.appendChild(_text);
      _label.appendChild(_legend);
      _nav.appendChild(_input);
      _nav.appendChild(_label);
    });
    this._container.appendChild(_fragment);
    return this._container;
  }

  onRemove() {
    this._container.parentNode.removeChild(this._container);
    this._map = undefined;
  }

  updateLegend(id) {
    let filter = this._map.getFilter('building_pol');
    if (filter){
      const [any, ...filters] = filter[2];
      filter[2] = [any, ...toggle(filters, ["in", this.field, id], (item) => item[2])];
      this._map.setFilter('building_pol', filter);
    }
  }
}
map.addControl(new legendControl(categories, categories_field), 'bottom-left');
Now we will style our legend control. In the style section of the page write:
#map {position: absolute; top: 0; bottom: 0; width: 100%;}

.filter-group {
  font: 12px/20px 'Ubuntu', sans-serif;
  font-weight: 400;
  position: absolute;
  bottom: 25px;
  z-index: 1;
  border-radius: 4px;
  width: 150px;
  color: rgba(51, 51, 89, 1);
  box-shadow: 0px 15px 68px rgba(51, 51, 89, 0.15);
  background: rgba(255, 255, 255, 0.9);
}
.filter-group input[type='checkbox']:first-child + label {
  border-radius: 6px 6px 0 0;
}
.filter-group label:last-child {
  border-radius: 0 0 6px 6px;
  border: none;
}
.filter-group input[type='checkbox'] {
  display: none;
}
.filter-group input[type='checkbox'] + label {
  display: block;
  cursor: pointer;
  padding: 10px;
  border-bottom: 1px solid rgba(0, 0, 0, 0.25);
  text-transform: capitalize;
}
.filter-group input[type='checkbox'] + label i {
  width: 18px;
  height: 18px;
  float: right;
  margin-right: 0 8px;
  opacity: 0.7;
}
.filter-group input[type='checkbox'] + label:hover {
  background-color: rgba(49, 112, 254, 0.05);
}
.filter-group input[type='checkbox'] + label:before {
  content: '';
  margin-right: 15px;
}
.filter-group input[type='checkbox']:checked + label:before {
  content: '✔';
  margin-right: 5px;
}
Reload the page, the legend control should be in the lower-left corner of the map. If we click on some of the categories in the legend we will see that the visibility of the buildings in that category changes.
Show a satellite view image of the selected building
To create the image of the aerial view of the building we will use the MapTiler Cloud Static Maps API.
We will modify the information shown when selecting a building to show the image of the satellite view of it.
To create the satellite view image of the building, we need to know the bounding box of the building. We are going to use the Turf.js library that allows us to obtain the bounding box of a geometry.
At the head of the page copy the following line to add the Turf library:
<link href="https://cdn.maptiler.com/maptiler-geocoding-control/v0.0.98/style.css" rel="stylesheet"/>
<script src='https://unpkg.com/@turf/turf@6/turf.min.js'></script>
<title>MapTiler Cloud API - example</title>
Add the following line to the start of the createPopupContent function:
const createPopupContent = (feature) => {
  const bounds = turf.bbox(feature);
  return `<div><strong>Reference: <a href="${feature.properties.informationSystem}" target="_blank" rel="noopener noreferrer">${feature.properties.reference}</a></strong></div>
  <div>${feature.properties.value}${feature.properties.value_uom}</div>
  <div><strong>Use</strong>:${feature.properties.currentUse}</div>
  <div><strong>Date</strong>:${new Date(feature.properties.end).getFullYear()}</div>
  <div><img src="${feature.properties.documentLink}" style="width:220px;height:165px"></div>
  `;
}
In the createPopupContent function call the staticMaps function to create the url of the satellite view image and add the image to the popup content.
const createPopupContent = (feature) => {
  const bounds = turf.bbox(feature);
  const imageURL = maptilersdk.staticMaps.bounded(bounds, {
    width: 220,
    height: 165,
    style: 'hybrid',
  });
  return `<div><strong>Reference: <a href="${feature.properties.informationSystem}" target="_blank" rel="noopener noreferrer">${feature.properties.reference}</a></strong></div>
  <div>${feature.properties.value}${feature.properties.value_uom}</div>
  <div><strong>Use</strong>:${feature.properties.currentUse}</div>
  <div><strong>Date</strong>:${new Date(feature.properties.end).getFullYear()}</div>
  <div><img src="${feature.properties.documentLink}" style="width:220px;height:165px"></div>
  <div><img src="${imageURL}" style="width: 100%"></div>
  `;
}
Additionally, we will change the information shown in the Use field to show the category text instead of the identifier code. For this, we are going to create a function that returns the text of the selected category.
Right after the toggle function copy the following lines:
const getUse = (use, categories) => {
  return categories.reduce((agg, item) => {
  return item.id === use ? item.text : agg;
  }, "Unknown");
}
We will call this function to display the information in the Use field.
const createPopupContent = (feature) => {
const bounds = turf.bbox(feature);
const imageURL = maptilersdk.staticMaps.bounded(bounds, {
width: 220,
height: 165,
style: 'hybrid',
});
return `<div><strong>Reference: <a href="${feature.properties.informationSystem}" target="_blank" rel="noopener noreferrer">${feature.properties.reference}</a></strong></div>
<div>${feature.properties.value}${feature.properties.value_uom}</div>
<div><strong>Use</strong>:${getUse(feature.properties[categories_field], categories)}</div>
<div><strong>Date</strong>:${new Date(feature.properties.end).getFullYear()}</div>
<div><img src="${feature.properties.documentLink}" style="width:220px;height:165px"></div>
<div><img src="${imageURL}" style="width: 100%"></div>
`;
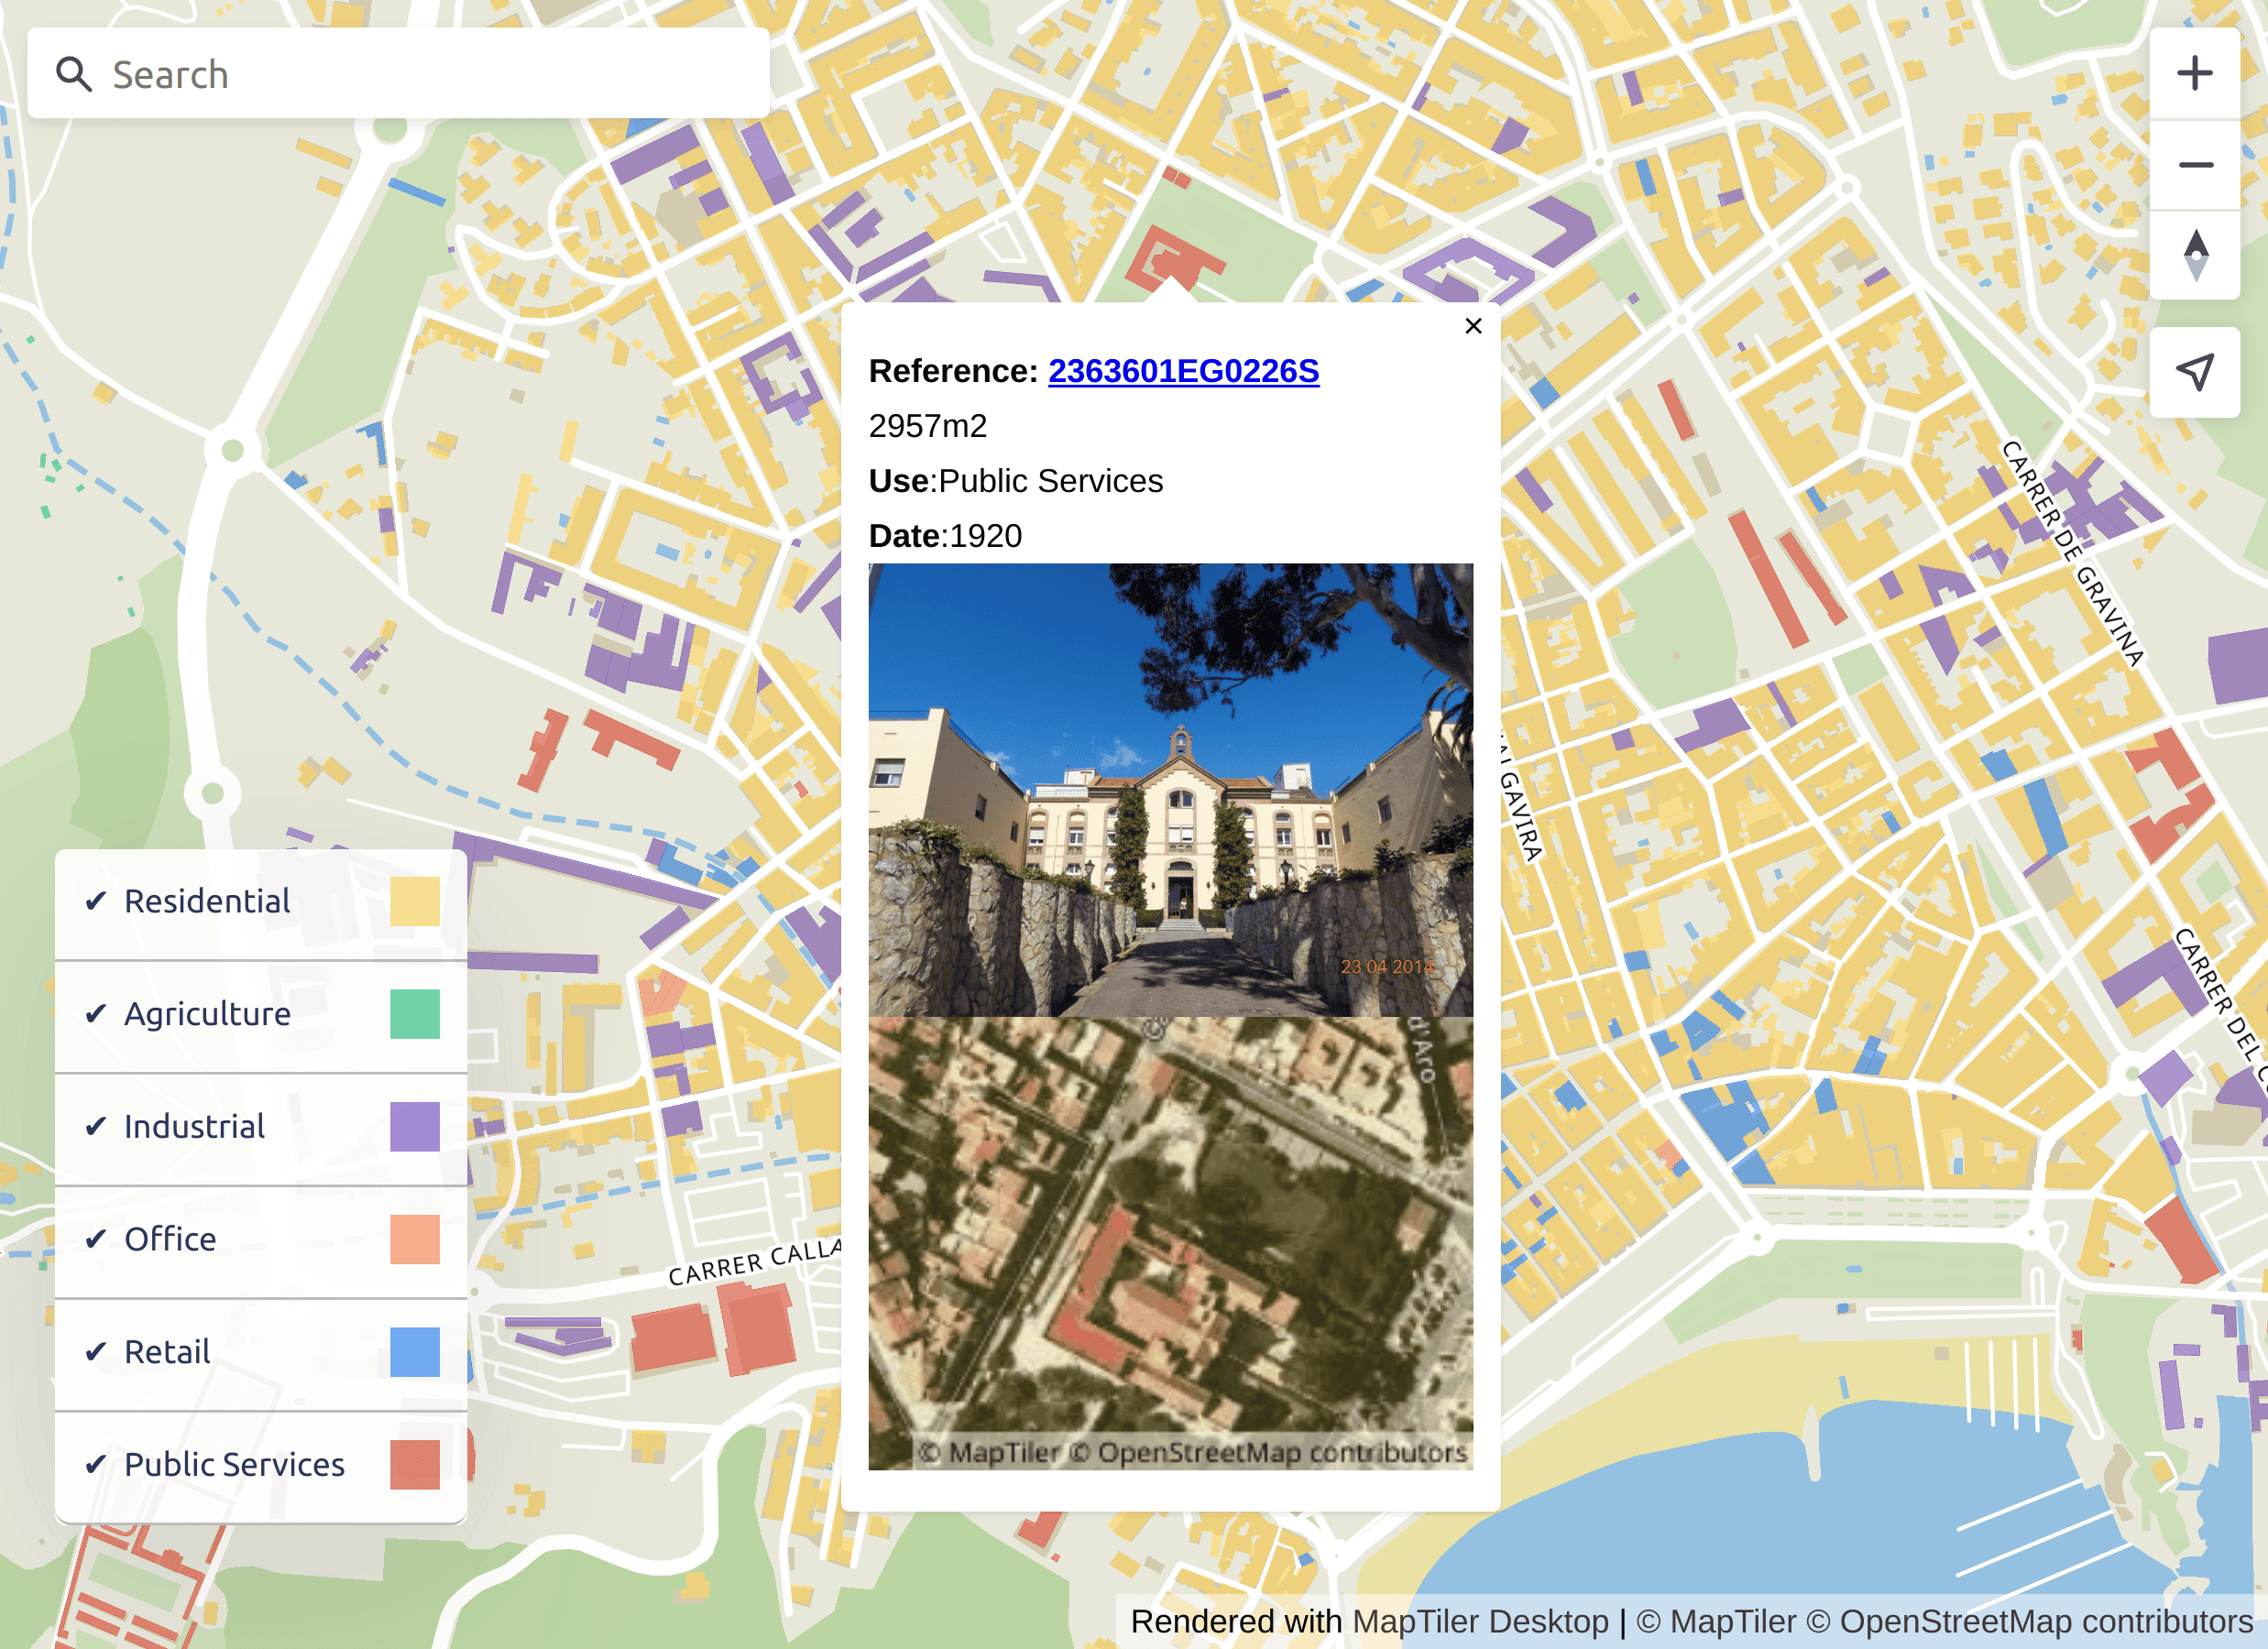
}Refresh the application and click on a building. You will see the information of the building along with an image of the aerial view of it.
Summary
In this article we have seen how to create an interactive map with our data using the MapTiler Cloud API together with the MapTiler SDK.
We have done:
- Use the Admin API to upload our data
- Upload a basemap thanks to the Maps API
- Use the Geocoding API component to search for places
- Visualize our data as vector tiles using the Tiles API
- Create a Choropleth map
- Create an interactive legend
- Create an image of the satellite view of a building using the Static Maps API